Media Appearances
- New York Times
- The Wall Street Journal
- New York Times
- USA Today
- Bloomberg TV
- NRA News
- AMAC.us (Money Columnist)
- MoneyNews.com
(Insider Columnist) - Forbes
- NASDAQ
- NBC News
- CNBC
- Fox Business Network
- CBS Moneywatch
- SmartMoney (Personal Finance Magazine of Wall Street Journal)
- Kiplinger's
- Newsmax
What Others Are Saying
Ed Reiter, Executive Director,


|
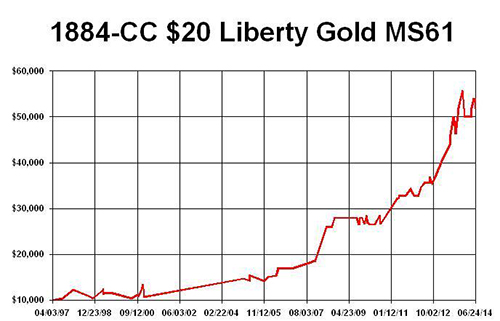
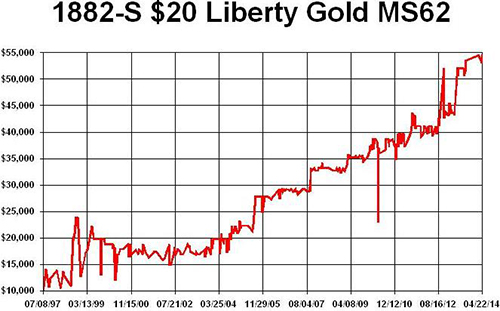
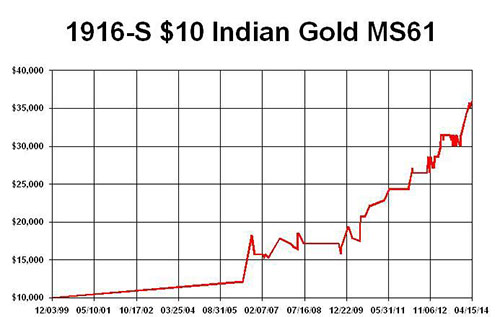
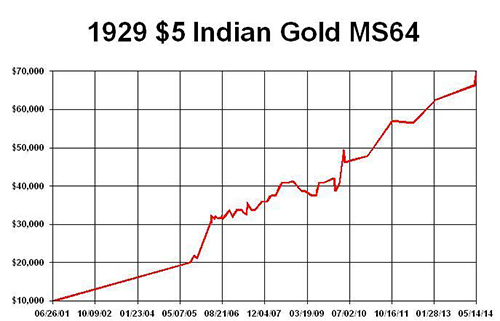
August 2014, Week 1 EditionGold ended July at just $1285 per ounce, its lowest closing price since June 18. Meanwhile, silver closed July at $20.69. This week, however, gold is trading around $1310 (+2%) and silver is about $20 (-3%), so the metals have parted ways for the short-term. A rise in gold while silver is falling is usually a sign of global unrest, of gold acting as a crisis hedge. In addition, the dollar has been strong relative to the euro, due to the unrest in Russia and an economic slowdown in Europe, so gold is rising faster in euro terms. Central Banks in the World’s “Hot Spots” are Stockpiling More GoldAccording to the latest data from the International Monetary Fund (IMF), Russia is stockpiling gold to help that huge nation weather any upcoming economic sanctions against their aggressive behavior in Ukraine. The Central Bank of the Russian Federation increased its gold holdings by 16.8 tonnes in June (that’s 540,000 Troy ounces, worth over $700 million at current prices), lifting its total gold holdings to a huge 1,094.8 tonnes. This reflects a doubling of Russia’s central bank gold holdings in the last five years. The latest IMF data also list some June gold purchases by the central banks in the same troubled region - namely, Kazakhstan, Kyrgyzstan and Tajikistan - as well as the Eastern European nations of Serbia and Greece, plus Ecuador and Mexico in the Western hemisphere. According to the IMF, global central banks held an estimated 30,500 tonnes of gold at the end of 2013, which represents over a decade’s worth of newly-mined gold and about one fifth of all the gold ever mined. For the first half of 2014, the world’s central banks added another 113 tonnes, with the biggest buyers being Russia, Iraq, and Kazakhstan. Gold Will Likely Soar when “Real War” Breaks OutGold rose to over $1320 last week based on new outbreaks of hostilities, including the U.S. air strikes in northern Iraq, a resumption of rocket attacks in Gaza and Israel, plus a Ukrainian fighter jet shot down by rebel forces in Eastern Ukraine. The outlook for a major war in Ukraine is growing each day, similar to the “Guns of August” escalation which led to the beginning of World War I a century ago this month. Nothing like World War I is about to happen, but if hostilities in Iraq, Syria, Israel and Ukraine erupt into all-out war at the same time, gold could experience the kind of surge we saw 100 years ago. From July 27 to August 7, 1914, $73 million in gold was withdrawn from New York banks alone. The rush to convert dollars to gold wiped out many banks in 1914, even though the U.S. was not involved in WWI until 1917. Global hostilities are still only “simmering,” not yet boiling. There has been a partial incursion into Iraq by Islamic forces and an exchange of rockets between Israel and Gaza. There has been saber-rattling between Russian rebels and Ukrainian soldiers, with Russian troops reportedly massing along Ukraine’s border. All of these situations are serious, but none of them has exploded into an all-out shooting war. (In addition, hostilities could break out at any time in North Korea or in China, defending its sea lanes.) August Begins Gold’s Best Time of the YearAnother reason for gold’s depressed price in July and its partial recovery in early August is the normal seasonal cycle of gold jewelry fabrication demand. June and July have historically been weak months for gold, while August marks the beginning of gold’s strongest season, running August through November. In the last five years, gold has risen each August by an average 5.6%, led by a $185 gain (+11.4%) in August 2011. Gold also rose by over 6% in August of 2010 and 2013, so gold is on a winning streak in the month of August, and also for the remaining months of the year, mostly due to the need for jewelry fabrication for the major gift-giving holidays around the world: Ramadan in Muslim lands, the Diwali season in India, Christmas in the West, then the Chinese New Year, followed by Valentine’s Day. This chart from Bloomberg outlines the best months during the recent gold bull market, 2000 to 2011. 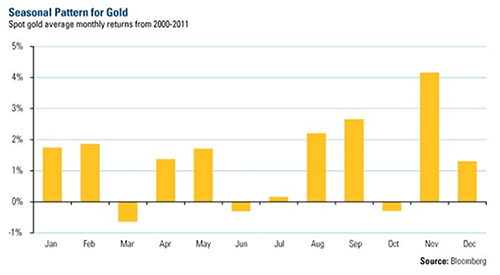 Rare Gold Coin Performance ChartsFor decades, I have liked better-date rare gold coins. I even wrote multiple NLG award-winning books about them. Currently I believe it is a historically opportune time to acquire select better-date gold coins in better grades. This week’s graphs show how a portfolio of multiple or fractions of coins totaling $10,000 in different rare gold coins would have increased in value over the time indicated that I have purchased them. These graphs reflect the price gains of actual coins I have been fortunate to buy, showing an increase from $10,000 to as much as $70,000. Some series are trending upward and others seem to be at bargain levels to many experts. Segments of this market now remind me of the old oil filter commercial that said “You can pay me now or pay me a lot more later.” I recommend at least a 5-10 year hold period on rare coin purchases as these graphs show impressive gains and volatility can occur during a shorter time span. We all know that past performance of some coins does not guarantee future performance for all coins. Many experts recommend buying better-dates and grades because of often better long-term performance for much of the past 100 years. Read my books to learn about famous successful long-term gold coin set builders like Louis Eliasberg. His set building provided him long-term benefits of diversification and significant premiums were later realized.
|

 Metals Market Report Archive >