Media Appearances
- New York Times
- The Wall Street Journal
- New York Times
- USA Today
- Bloomberg TV
- NRA News
- AMAC.us (Money Columnist)
- MoneyNews.com
(Insider Columnist) - Forbes
- NASDAQ
- NBC News
- CNBC
- Fox Business Network
- CBS Moneywatch
- SmartMoney (Personal Finance Magazine of Wall Street Journal)
- Kiplinger's
- Newsmax
What Others Are Saying
Ed Reiter, Executive Director,


|
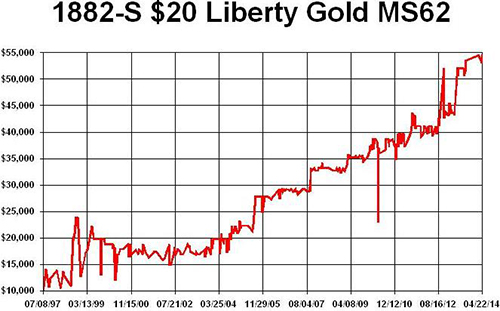
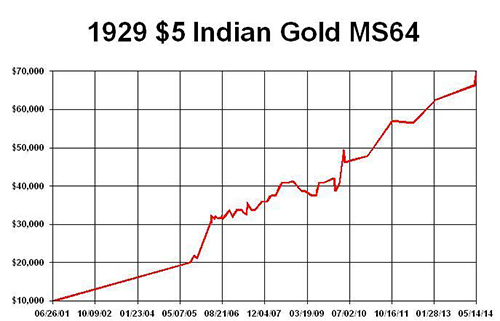
October 2014, Week 3 EditionGold rallied strongly in the middle of last week, while the stock market was undergoing one of its October spasms. Two weeks ago, on October 6, gold tested its $1192 low and passed with flying colors. Gold opened Monday morning, October 20 at $1245, up over $50 in two weeks. Meanwhile, the Dow Jones index has fallen by almost 1000 points in the last month. Typically, the fall months are very good for gold and bad for stocks, and it looks like this fall is shaping up to fit that “normal” historical pattern. Gold Production May Start Falling Next Year and Gold Prices Should RiseNewly mined gold is drying up in the 20th century’s leading gold mining country, South Africa, so gold miners are constantly looking for new sources of gold, but gold (by its nature) is very hard to find and expensive to mine. It is often found in politically repressive countries, whose leaders are prone to stealing (nationalizing) any foreign operations within their borders. For years, gold mining output has been fairly flat, but with the price down around $1200, we may be facing a situation in which new gold supplies fall. Canada’s Goldcorp is one of the largest and fastest-growing gold producers, with 16,000 employees and operations around the world. Goldcorp’s CEO Chuck Jeannes says that gold production might peak in 2015 and begin falling in subsequent years. He said that the number of new discoveries already peaked, in 1995. The grades (grams per ton) of gold are shrinking dramatically. If you combine that with rising affluence and demand in China and India, he says the price of gold should rise for the next 5-10 years. The fundamentals still work: Shrinking supply and rising demand usually push the price up, not down. Switzerland’s Important Gold “Election”Switzerland is not in the euro-zone, but an important gold “election” is coming in late November. In that election, voters will decide three gold-related initiatives: (1) To force the Swiss National Bank (SNB) to hold 20% of its reserves in gold; (2) to prohibit all gold sales by the SNB; and (3) to repatriate all Swiss gold held in foreign banks back into Switzerland. A “yes” vote on any of these initiatives could force the SNB to buy thousands of tons of gold over the next few years. Since new mines contribute only about 2500 tons per year, this could provide a powerful boost to global gold demand over the next three years. Whatever Happened to Rising Inflation?Europe is fighting deflation. The European Central Bank (ECB) has charged banks 0.2% for the right to hold euros in their bank. That’s a “negative interest rate,” a sure sign of deflation. Banks in the U.S. are also charging 0.2% for euro accounts and offering next-to-nothing on short-term U.S. dollar deposits. Last week, we learned that both the Producer Price Index (PPI) and Consumer Price Index (CPI) declined 0.1% in September, the first monthly decline in more than a year. In addition, the Fed’s favorite inflation indicator, the Personal Consumption Expenditure index (PCE), also fell by 0.2% in September. In this deflationary environment, the Fed will most likely NOT raise short-term interest rates any time soon. Crude oil prices have fallen from over $107 per barrel in June to under $80 last week, and they may fall to $75, despite a shooting war in the Middle East and the violent takeover of some major Iraq oil facilities by the Islamic State of Iraq and Syria (ISIL). In September, wholesale energy and food prices fell 0.7%. The Federal Reserve intends to wind up quantitative easing (QE) next week, during their October 28-29 meeting of the Federal Open Market Committee. In the last six years, the Fed has more than quintupled its balance sheet (monetary assets), from $800 billion to over $4 trillion. Where did all that money go? The main reason why QE has not produced inflation is because most of the money is just sitting in banks, earning 0.25%. Banks aren’t lending out the money, as a rule, so the money is not circulating, bidding up prices. If anything, the money has moved into stock and bond speculation rather than into bank loans. The fact that gold is rising while stocks and consumer prices are falling shows that gold is a “deflation hedge” as well as an inflation hedge. In truth, gold is an overall “currency hedge” against either extreme. Good News: Gold Tends to Perform Well During DeflationsThere were two historic times of falling prices in U.S. history. First, in the 1870s and 1880s, and once again in the 1930s. The United States was under the gold standard during those deflationary epochs. With a stable gold price, a deflationary environment means that gold is rising in “real” purchasing power. Historians call the 1870s to early 1890s the “Great Deflation,” a time in which the prices for goods and services (materials and labor) declined, usually by a rate of 1% to 2% per year. Gold was priced at $20.67 per ounce and the silver mining interests lobbied for a 16:1 ratio for silver at $1.29 per ounce. The main battle during elections of the 1890s was between the “gold bug” Republicans (who favored a single gold standard) and the bi-metallic Democrats, who liked silver (the “poor man’s gold”). The Democrat William Jennings Bryant said the Republicans were crucifying the working man on a “Cross of Gold.” (The Republicans won most Presidential elections, and the gold standard remained the law of the land. From 1868 to 1908, the Republicans won every Presidential election except two by Grover Cleveland.) In the 1930s, gold was revalued by presidential fiat from $20.67 to $35.00 per ounce in a decade in which most other prices were falling, due to a tight constriction of the money supply by the Federal Reserve. Gold increased 69% in price in 1934, but most Americans were forbidden from owning common gold coins or bullion bars. The stock market careened downward for most of the 1930s, but the gold-mining stocks flourished. Most Americans who wanted to profit from the rising gold price were able to buy stocks like Homestake Mining, which prospered from the upward revision in the price of the gold they were mining. In Europe today, where deflation reigns supreme, gold is rising much faster in euro terms than it is in U.S. dollar terms. Gold currently trades at 973 euros per ounce (that’s $1245 divided by the current $1.28 exchange rate for euros), up from 857 euros at the start of the year ($1200 divided by $1.40). That means the euro price of gold is up 13.5% while prices for consumer goods are flat or declining, so gold is the big winner on the continent most plagued by deflation - Europe. If Europe’s deflation continues to be exported to the United States in the future months, then it’s likely that gold will rise in U.S. dollars, too. Bottom line, gold investors should not worry about the lack of inflation. Deflation loves gold, too. Rare Gold Coin Performance ChartsFor decades, I have liked better-date rare gold coins. I even wrote multiple NLG award-winning books about them. Currently I believe it is a historically opportune time to acquire select better-date gold coins in better grades. This week’s graphs show how a portfolio of multiple or fractions of coins totaling $10,000 in different rare gold coins would have increased in value over the time indicated that I have purchased them. These graphs reflect the price gains of actual coins I have been fortunate to buy, showing an increase from $10,000 to as much as $70,000. Some series are trending upward and others seem to be at bargain levels to many experts. Segments of this market now remind me of the old oil filter commercial that said “You can pay me now or pay me a lot more later.” I recommend at least a 5-10 year hold period on rare coin purchases as these graphs show impressive gains and volatility can occur during a shorter time span. We all know that past performance of some coins does not guarantee future performance for all coins. Many experts recommend buying better-dates and grades because of often better long-term performance for much of the past 100 years. Read my books to learn about famous successful long-term gold coin set builders like Louis Eliasberg. His set building provided him long-term benefits of diversification and significant premiums were later realized.
|